Dashboard tour
What the numbers mean and how to read them.
Your worlds list
The main dashboard shows every world you've registered. Each card shows a status badge, a recent-activity indicator, and a key-reveal button. Badges you'll see:
- Waiting for first beacon — world is registered but hasn't fired a beacon yet. Binds on the first join after upload.
- Active — world is live and receiving beacons
- Deleted on VRChat — our daily check couldn't find this world on VRChat's API. Data preserved.
- Unlisted — world is no longer marked public on VRChat
Overview stats
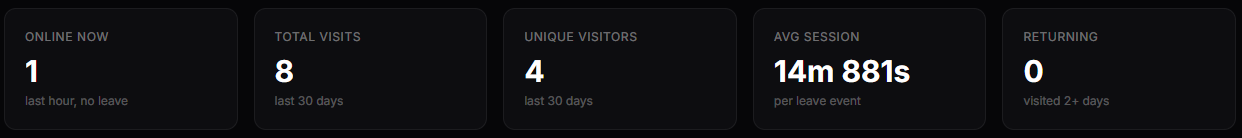
Online Now
Sessions with a join event in the last hour and no subsequent leave. Counts players currently in any instance of your world across all regions.
Visits
Visits in the selected time window. One visit = one player's session within an hour, so a crash-rejoin a minute later still counts as a single visit. We deliberately don't claim person-level "unique visitors" — the beacon carries no player identity, by design.
Avg Session
Average session duration in seconds, computed from paired join/leave events. Sessions without a matching leave (player crashed, force-closed VRChat) aren't counted.
Charts
- Daily visits — visits per day
- Platform breakdown — PC VR / desktop / Quest share
- Peak hours — which hours of the day see the most traffic
- Day-of-week heatmap — traffic intensity across weekdays × hours
- Session distribution — how long players typically stay
- VR vs desktop — share of sessions played in VR (PC VR or Quest) vs flat-screen
- FPS health — frame-rate distribution per platform, sampled every minute in-world
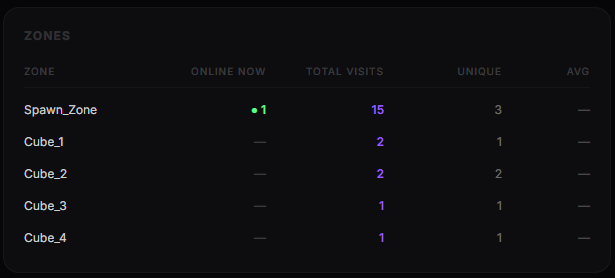
Zone table
If you set up a Zone Beacon, each zone shows four columns: Online now (green dot = live count), Entries (every zone crossing), Visits (distinct sessions), and average dwell. Overlapping zones count a player in each overlapping zone — expected behavior for nested areas likefirst_floor containing lobby.
Suspicious source warning

When beacons arrive with a User-Agent that doesn't look like a VRChat client (curl, scripts, browsers), they're flagged. A small number is noise (occasional bot scans). A sustained count from a few IPs suggests someone is spamming your endpoint — consider rotating your setup key.
Data export
Each world page has a CSV export button that dumps the raw events for your own off-platform analysis. Includes timestamps, event types, session IDs, platforms, and durations.